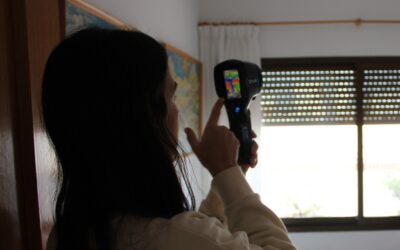
A monitoring campaign was performed in the Valencia city pilot during February and March 2023. Among the 23 monitored dwellings, two different scenarios related to two different stages of the customer journey were studied and analysed: dwellings with and without renovation measures.
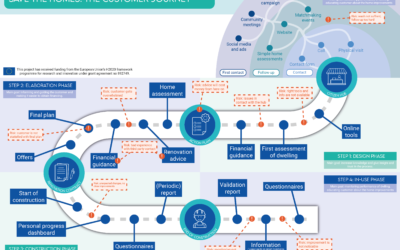
In the first case, dwellings that had no renovation measures implemented, occupants aimed to know how their dwellings performed and how to improve them. These cases correspond with the step 1 – Design Phase of the customer journey where a first assessment of the dwelling is done, renovation options (using pre diagnosis online tools) and financial guidance are provided informing about the estimated cost of the measures and the available grants. The purpose was to increase the knowledge and evidence of renovation needs and give insights and trust in the process to the customer.
The second scenario, dwellings that had made energy improvements in their houses, occupants were interested in knowing the energy performance comparison before and after the renovation process. These cases correspond with the final stage of the customer journey Step 4 – In-use phase. The purpose of this step is the monitoring of the dwelling’s performance and the benefit of the renovation. These experiences will be shared with other potential customers in the Stop 0 – Onboarding phase to show people real-life cases and encourage them to join the customer journey and renovate their homes.
For each monitored dwelling, a report with the analysis of the monitored data and the personalized recommendations was prepared. This report maintains the same structure for both scenarios (with or without renovation measures) but presents different analysis and recommendations depending on the scenario.
Dwellings without renovation measures: Step 1 – Design phase
The following images correspond to the report of one of the monitored dwellings and it is an apartment from a residential building built in 2001. The first part of the report shows the data gathered during the monitoring campaign and contains the following information:
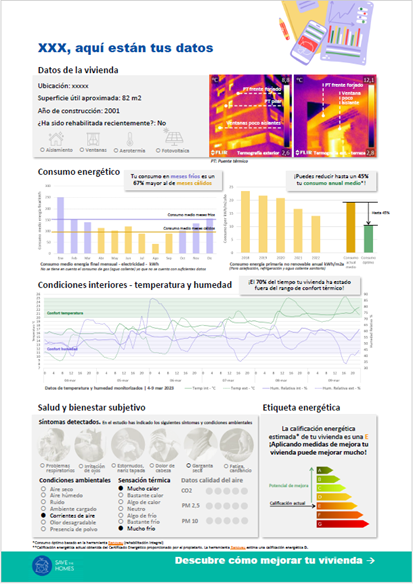
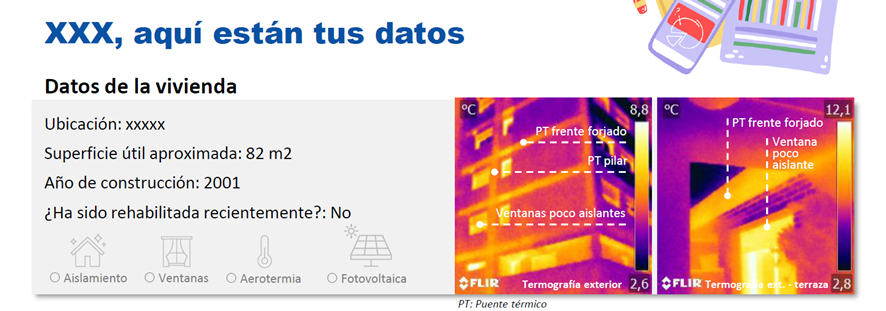
- Dwelling data: First, the data from the dwelling is shown including location, surface, year of construction and implemented measures (if any). It also shows two thermographic images of the dwellings highlighting the points where the envelope loses energy.
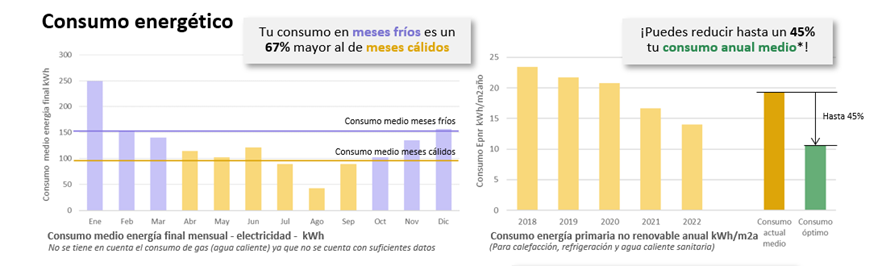
- Energy consumption: on the left it is shown the average final monthly electricity consumption using the available data (2018-2022) highlighting the average consumption in the cold and hot months. In this case the consumption during the cold months was 67% higher than during the hot months. On the right, the annual non-renewable primary energy consumption for the 5 years and the average is compared to the optimal consumption after doing a deep renovation (based on renovEU). In this case, it can be saved until 45% of energy.
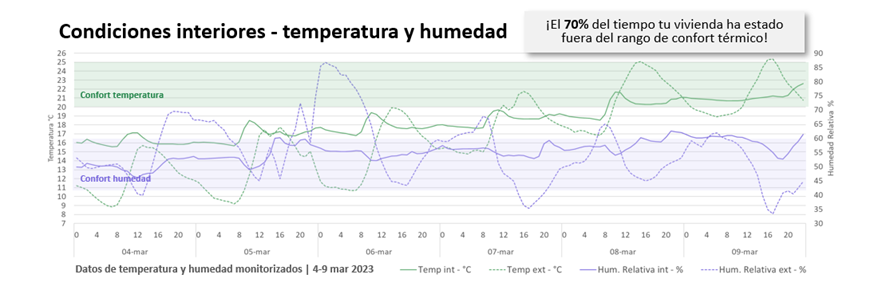
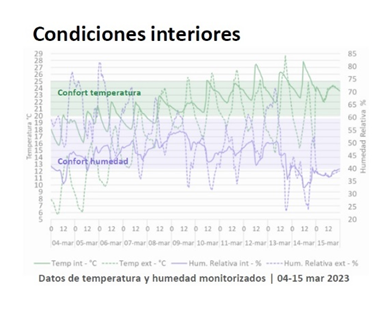
- Indoor conditios – temperature and relative humidity: It shows the data gathered from the sensors installed in the dwelling for both indoor and outdoor conditions. The graphs also shows the confort range for temperature (green) and relative humidity (purple) concluding that 70% of the monitored time, the dwelling was out of that range of thermal comfort.
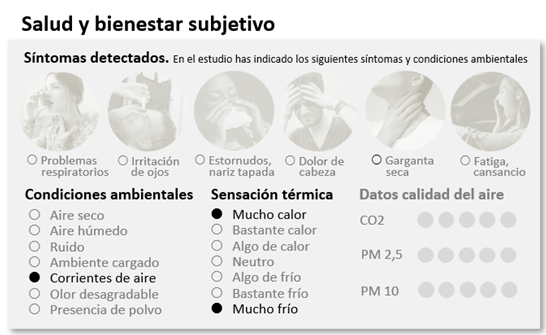
- Health and wellbeing: in this section the data collected from the questionnaire and the occupants’ interview about the symptoms, indoor conditions and thermal feeling is shown. In this case, occupants did not indicate symptoms but they complained about discomfort due to draughts and too much heat and cold.
This section also shows the data displayed by the Trotec BQ30, if it is availabe. In this case, no Trotec BQ30 monitor was installed in the dwelling.
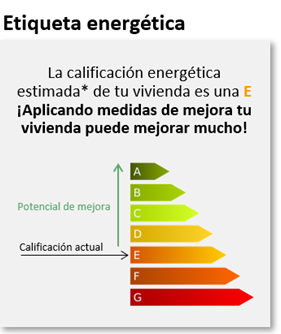
Energy Performance Certificate: in this part the energy label is shown. In this case the dwelling has a E.
The rest of the report presents the personalized recommendations for this dwelling based on the monitored data. In this case, recommendations for reducing the energy consumption during the cold months are prioritized and measures to improve the indoor comfort level for both winter and summer conditions.
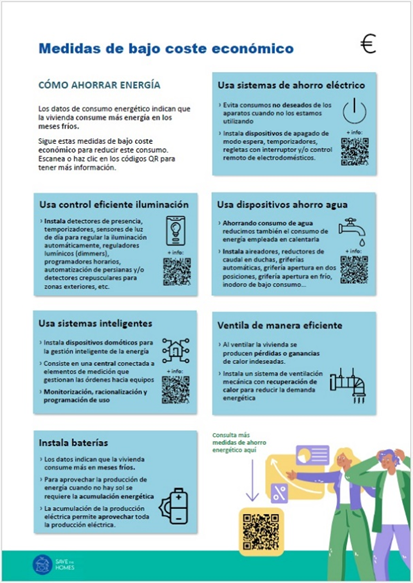
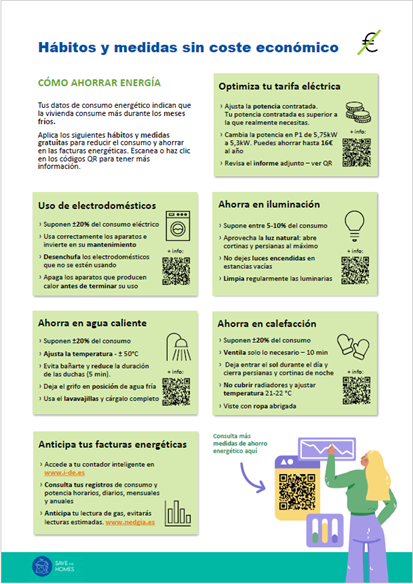
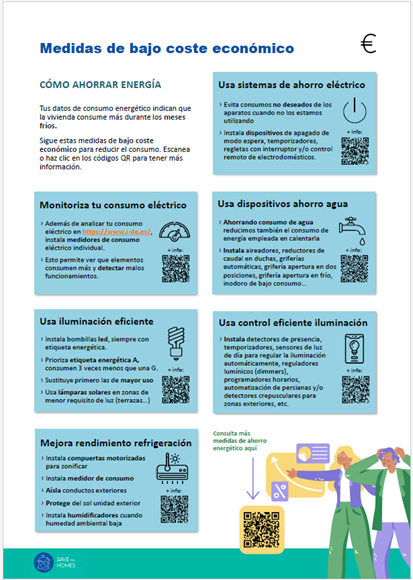
The recommendations are divided into 1_measures without economic cost, 2_measures with a low economic cost and 3_measures with an economic investment.
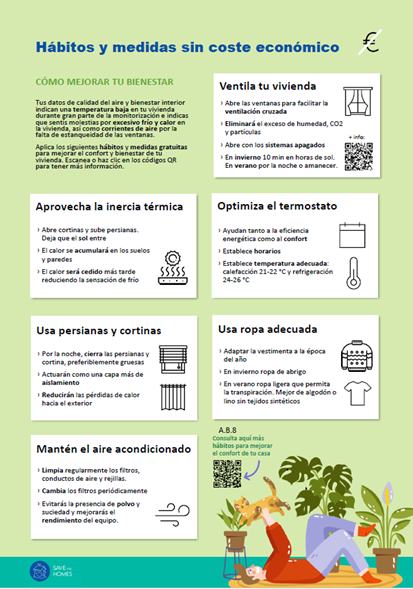
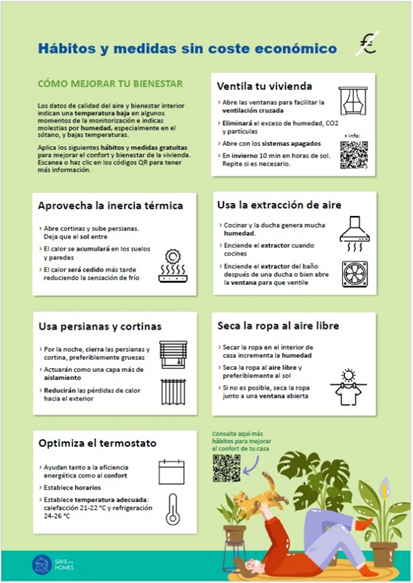
1_Measures without economic cost (green pages): One side of the page shows the measures for saving energy (left), such as the optimization of the electricity tariff reducing the contracted power and tips for saving on lighting, hot water and heating, among others, and on the other side of the page, it is shown the recommendations that help to improve the health and wellbeing of the dwelling (right) such as how to ventilate efficiently, take advantage of the building’s thermal inertia, use blinds and curtains or optimize the thermostat. The report shows a brief explanation of each measure and, in some of them, more information is available through a QR code.
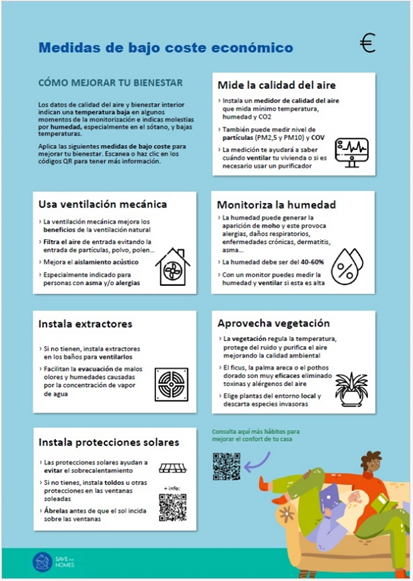
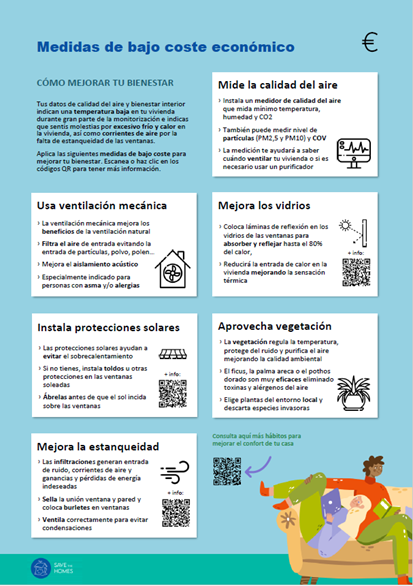
2_Measures with a low economic cost (blue pages): Following the same schema as in the previous one, one side of the page shows low-cost measures to save energy such as monitoring the energy consumption, using efficient lighting or water saving devices, and the other side shows low costs measures to improve the indoor comfort of the occupants such as installing indoor air quality monitors, improving the glazing, installing sun protections or improving the air tightness.
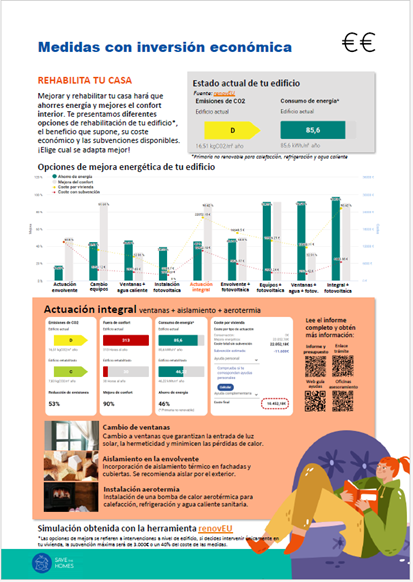
3_Measures with an economic investment (orange pages): This page shows the renovation options for the monitored dwelling. The information is obtained from the online diagnosis tool developed during the project RenovEU. The first side of the page is divided in three sections:
- Estimation of the energy performance of the current state of the dwelling.
- Graph with the different renovation options showing the energy savings, comfort improvement, economic cost per dwelling and cost considering the available grants.
- Explanation of the Deep renovation option (windows + insulation + aerothermal). It is shown the CO2 emissions, percentage of time out of comfort, the energy consumption for the pre and post renovation status, and the cost per dwelling with and without grants. A brief explanation of the measures is shown and QR codes link to the complete report, the budget, the grants information, and the energy offices information.
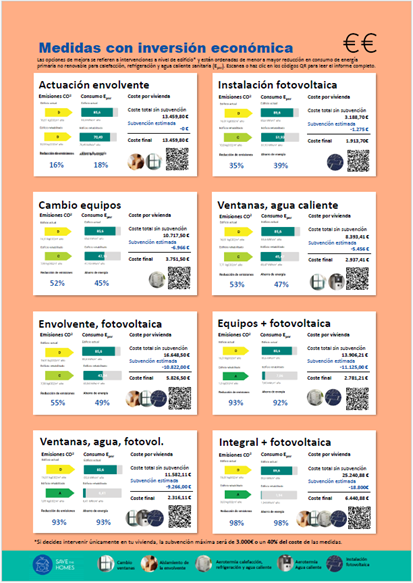
The other side of the page presents eight more options of renovation showing the comparison between the pre and post renovation state for the CO2 emissions and the energy consumption. It is also presented the cost of the measures with and without grants. The full report for each option is available through the QR code. The eight sets of renovation measures presented are:
- Intervention on the envelope (windows + insulation)
- Systems renovation (aerothermal)
- Windows renovation + hot water (aerothermal)
- Photovoltaic installation
- Intervention on the envelope + photovoltaic installation
- Systems renovation + photovoltaic installation
- Windows + hot water + photovoltaic installation
- Deep renovation + Photovoltaic
Dwellings with renovation measures. Step 4 – In-use phase
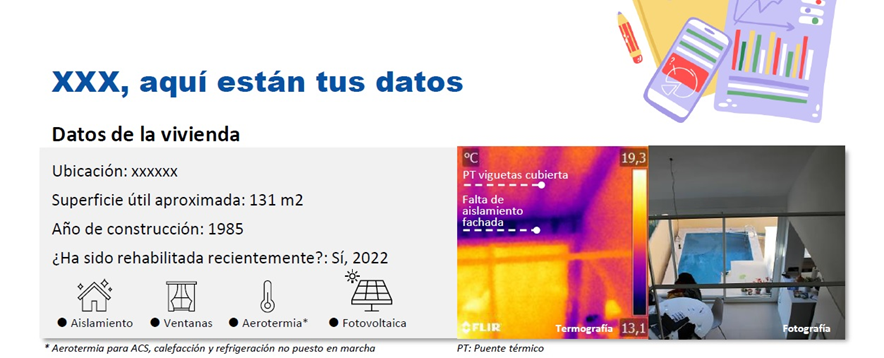
The following images correspond to the report of one of the monitored dwellings that performed a deep renovation. In this case, it is a terraced house built in 1985. The first part of the report shows the data gathered during the monitoring campaign and contains the following information:
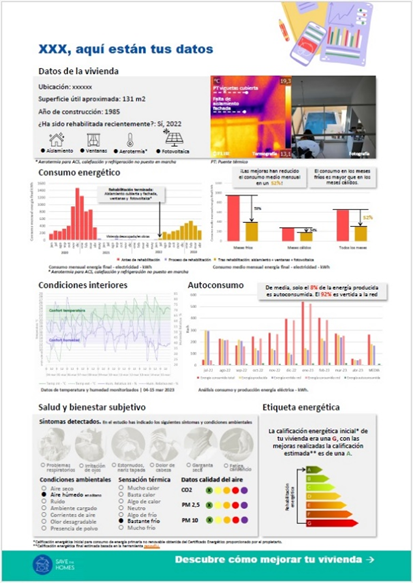
- Dwelling data: the data from the dwelling is shown including location, surface, year of construction and implemented measures. In this case, the renovation process included insulation of the envelope, new windows, aerothermal system for hot water, heating and cooling and photovoltaic panels in the roof. This section also shows a thermographic image of the dwellings highlighting the points where the envelope loses energy.
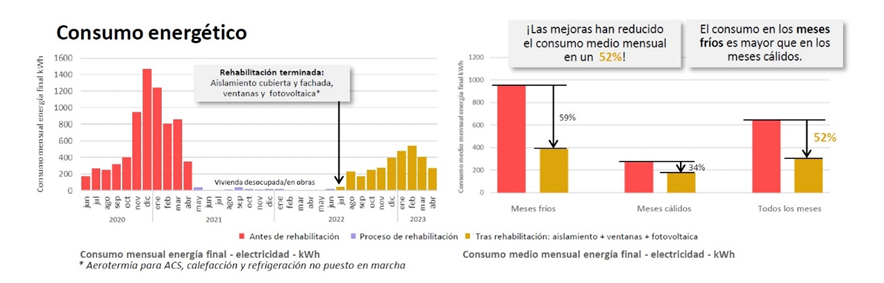
Energy consumption: on the left it is shown the monthly electricity consumption using the available data (2020-2023) and the average (during the whole perior and for the cold and hot months) highlighting the reduction of 52% of the energy consumption due to the measures implemented.
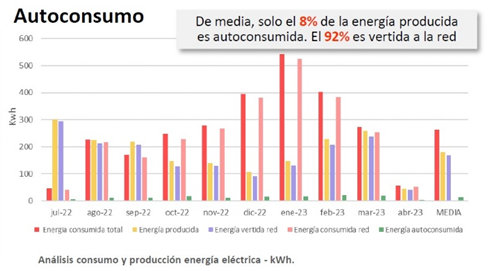
Self-consumption: this section analyses the energy production, total energy consumption, energy consumed from the network, energy self-consumed and energy put into the network. In this case, it was seen than only the 8% of the produced energy was consumed by the dwelling.
Indoor conditios – temperature and relative humidity: In this case, almost all the time the dwelling’s indoor conditions were in the confort level.
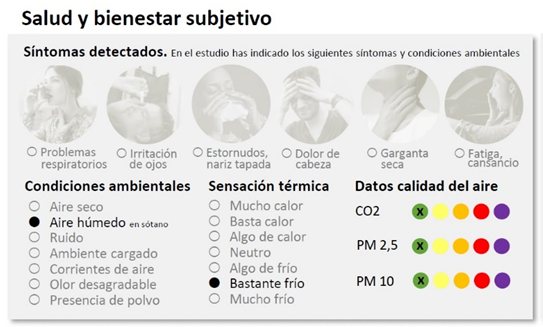
- Health and wellbeing: In this case, occupants did not indicate any symptoms but they complained about discomfort due humid air (in the basement) and quite cold during winter season.
This section also shows the data displayed by the indoor air quality monitor (Trotec BQ30) and in this case, no signals of bad air quality were registered by the occupants.
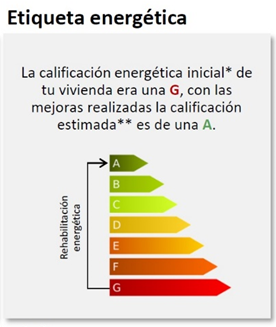
Energy Performance Certificate: the deep renovation process allowed to improved the energy performance certificate from a G to a A.
The rest of the report presents the personalized recommendations for this dwelling based on the monitored data. Although this dwelling has already done a deep renovation, recommendations without economic cost and low-cost measures are provided to improve the dwelling’s energy efficiency and the comfort level of the occupants.
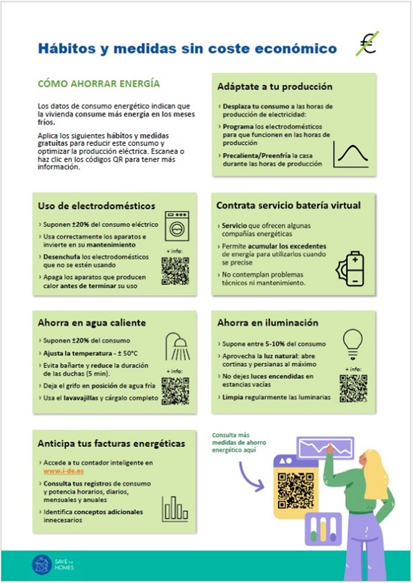
1_Measures without economic cost (green pages): One side of the page shows the measures for saving energy (left), such as the adaptation of the energy consumption to the energy production, the contracting virtual batteries, or tips for savings in lighting or appliances, among others, and on the other side of the page, it is shown the recommendations that help to improve the health and wellbeing of the dwelling (right) such as how to ventilate efficiently, take advantage of the building’s thermal inertia, use blinds and curtains or optimize the thermostat. The report shows a brief explanation of each measure and, in some of them, more information is available through a QR code.
2_Measures with a low economic cost (blue pages): Following the same schema as in the previous one, one side of the page shows low-cost measures to save energy such as using energy saving devices, smart systems, water saving devices, or energy efficient ventilation systems, and the other side shows low costs measures to improve the indoor comfort of the occupants such as installing indoor air quality monitors, installing sun protections and/or mechanical ventilation systems.